Analytics
The analytics page is a one-stop-shop for all your reports and data, separated into different sections, it allows you to drill down into minute details to understand how people are using the portal and your content, how content is doing, how classes are doing, and even individual Trainees.
Overview

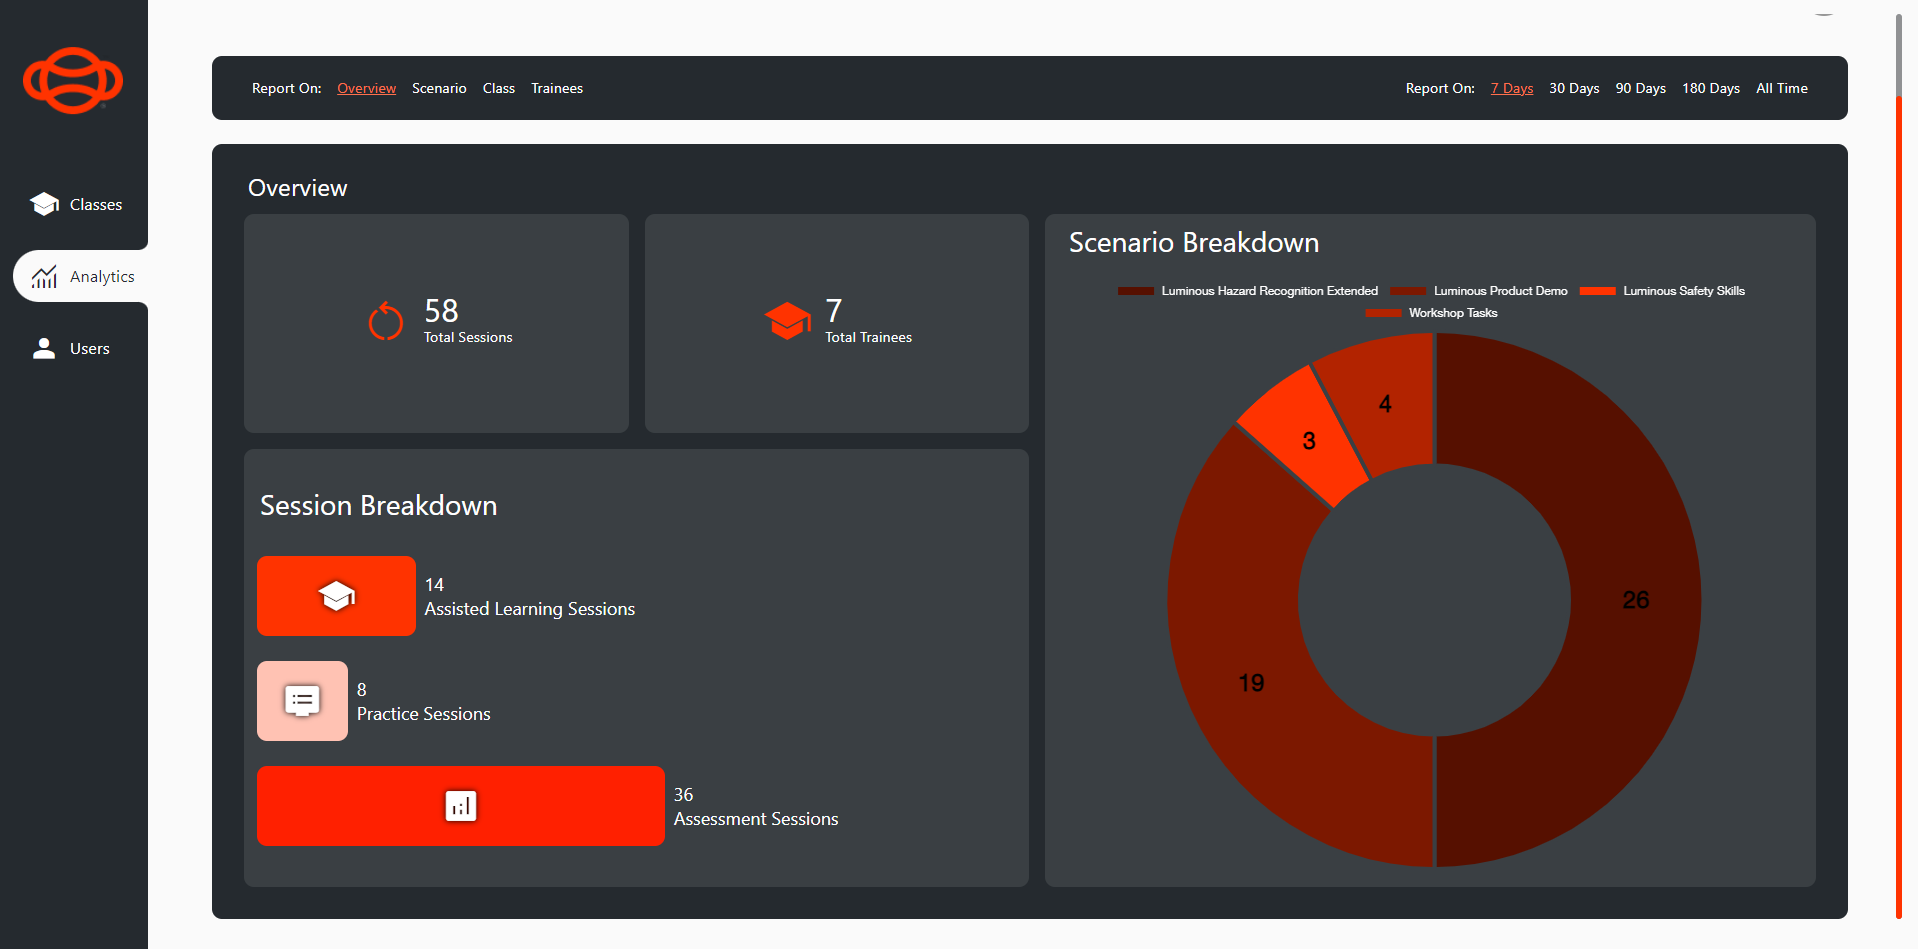
Analytics - Overview Page
By default, when you go to the analytics page, the “Overview” section will be selected, showing you global data. At a glance, you can see how active your content and portal is, with the “Total Sessions” section, you can see how many Trainees are registered with the “Total Trainees” section, which pieces of training content are being used the most with the “Scenario Breakdown” section, and which mode is being used the most with the “Session Breakdown” section. All of this data can also be filtered using the date filters in the top right, filtering by “7 days”, “30 Days”, “90 Days”, “180 Days” or “All Time”.
Scenario
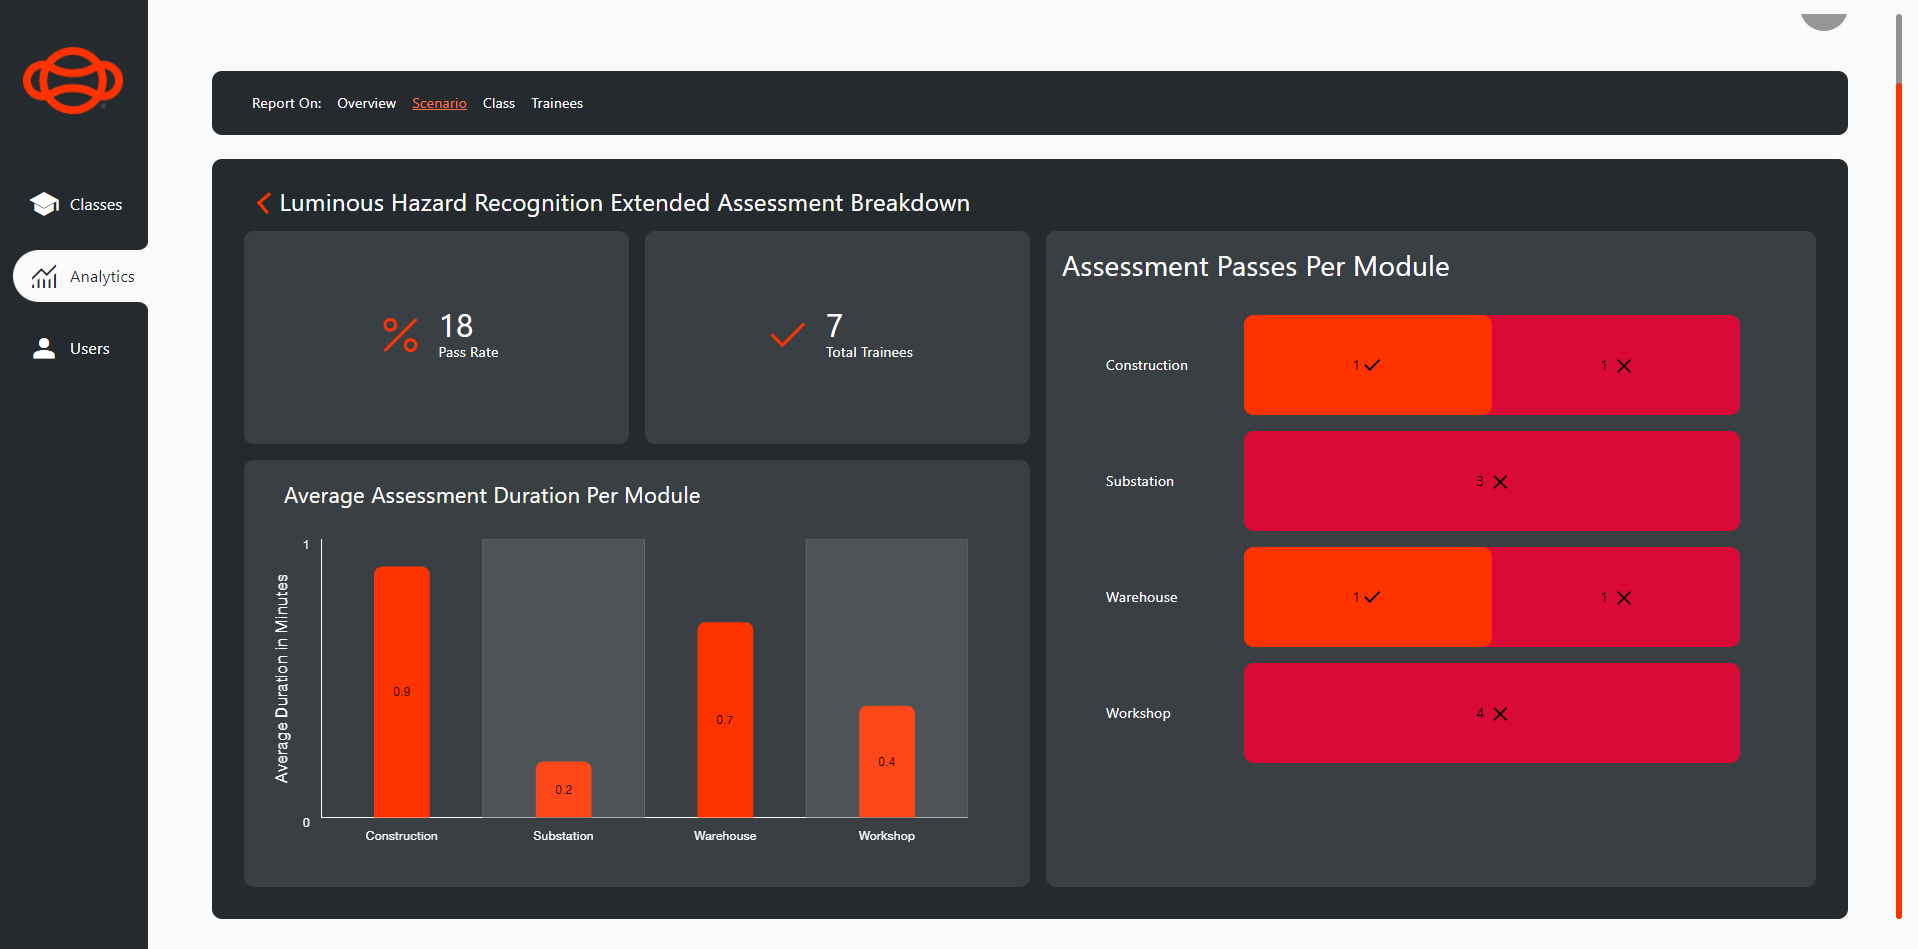
Using the top bar, you can select the “Scenario” button to see all your content and report on them individually. This includes the “Pass Rate” of the content, how many Trainees have access to that content with “Total Trainees”, how many passed and failed assessments there have been per module with the “Assessment passes per module” section, and the average time it takes users to complete an assessment per module with the “Average Assessment Duration per module” section.

Analytics - Scenario
Class
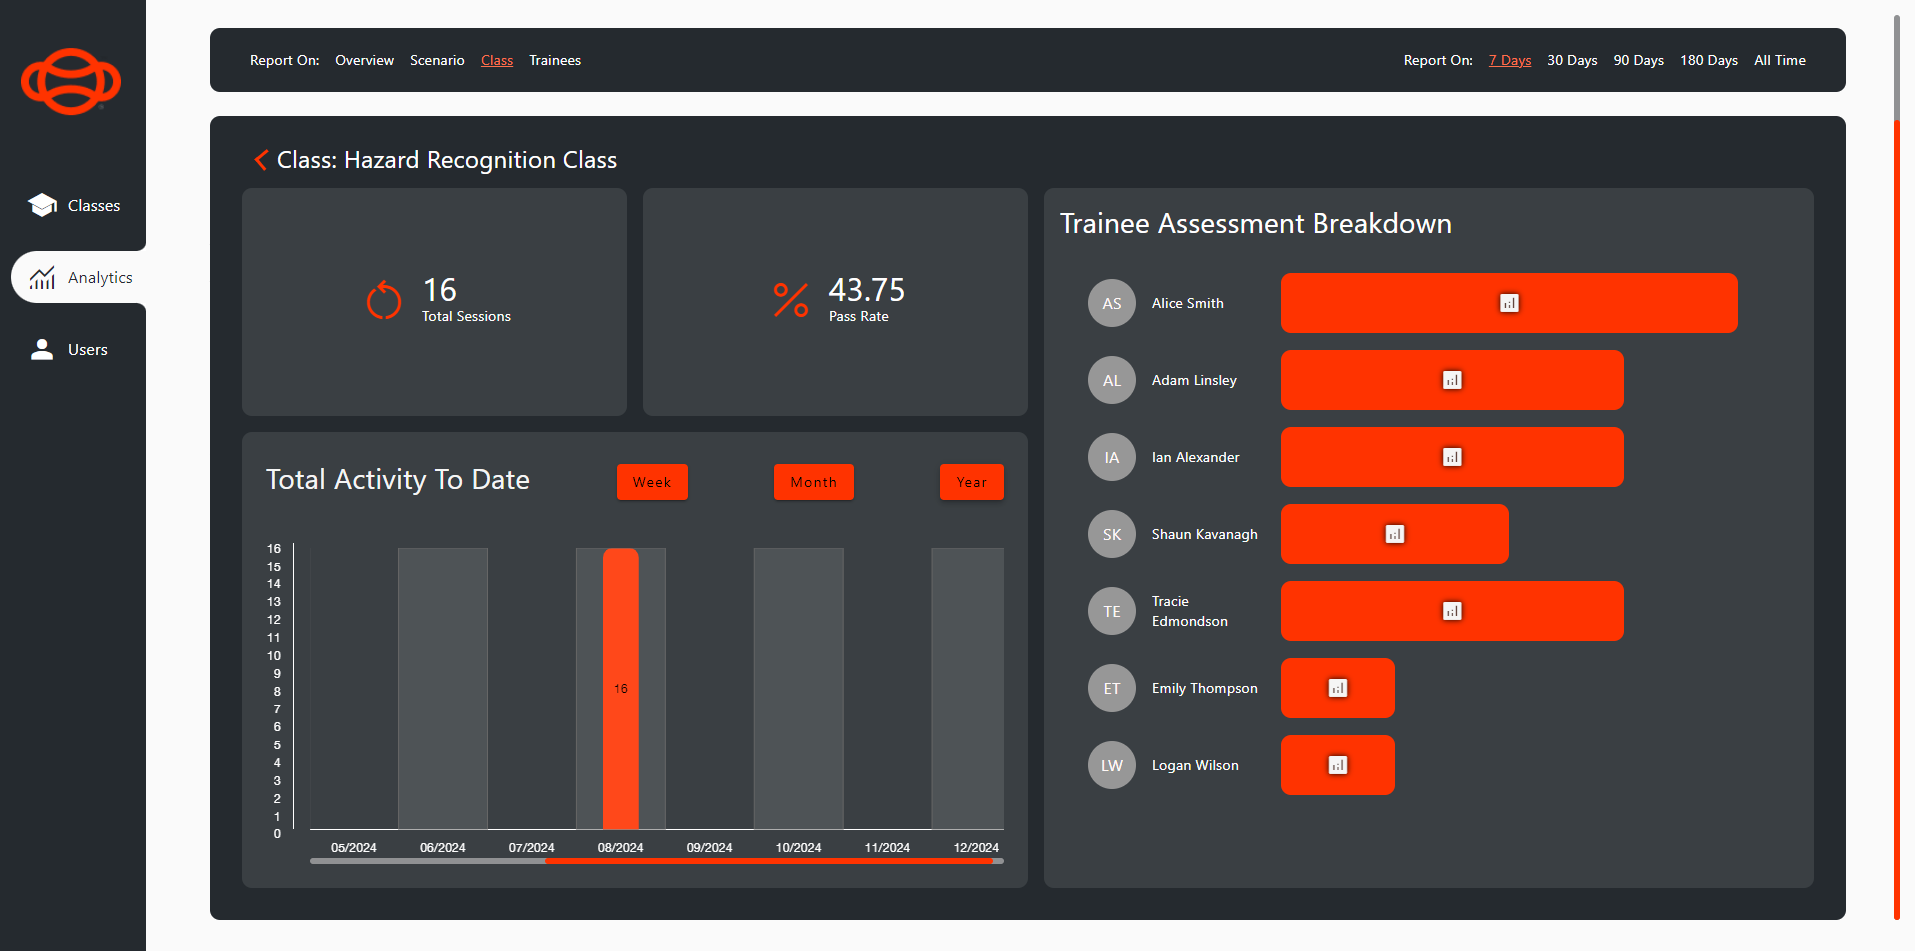
To take a look at how classes are doing, select the “Class” section on the top bar, and select a class from the list to report on. This section drills down into the class, Trainees and sessions. Take a look at how many sessions the class has with “Total Sessions” section, the pass rate of the class with “Pass Rate”, a breakdown of how many assessments Trainees have passed with “Trainee Assessment Breakdown”, and how active the class is with the “Total Activity to Date” section.

Analytics - Class
Trainee
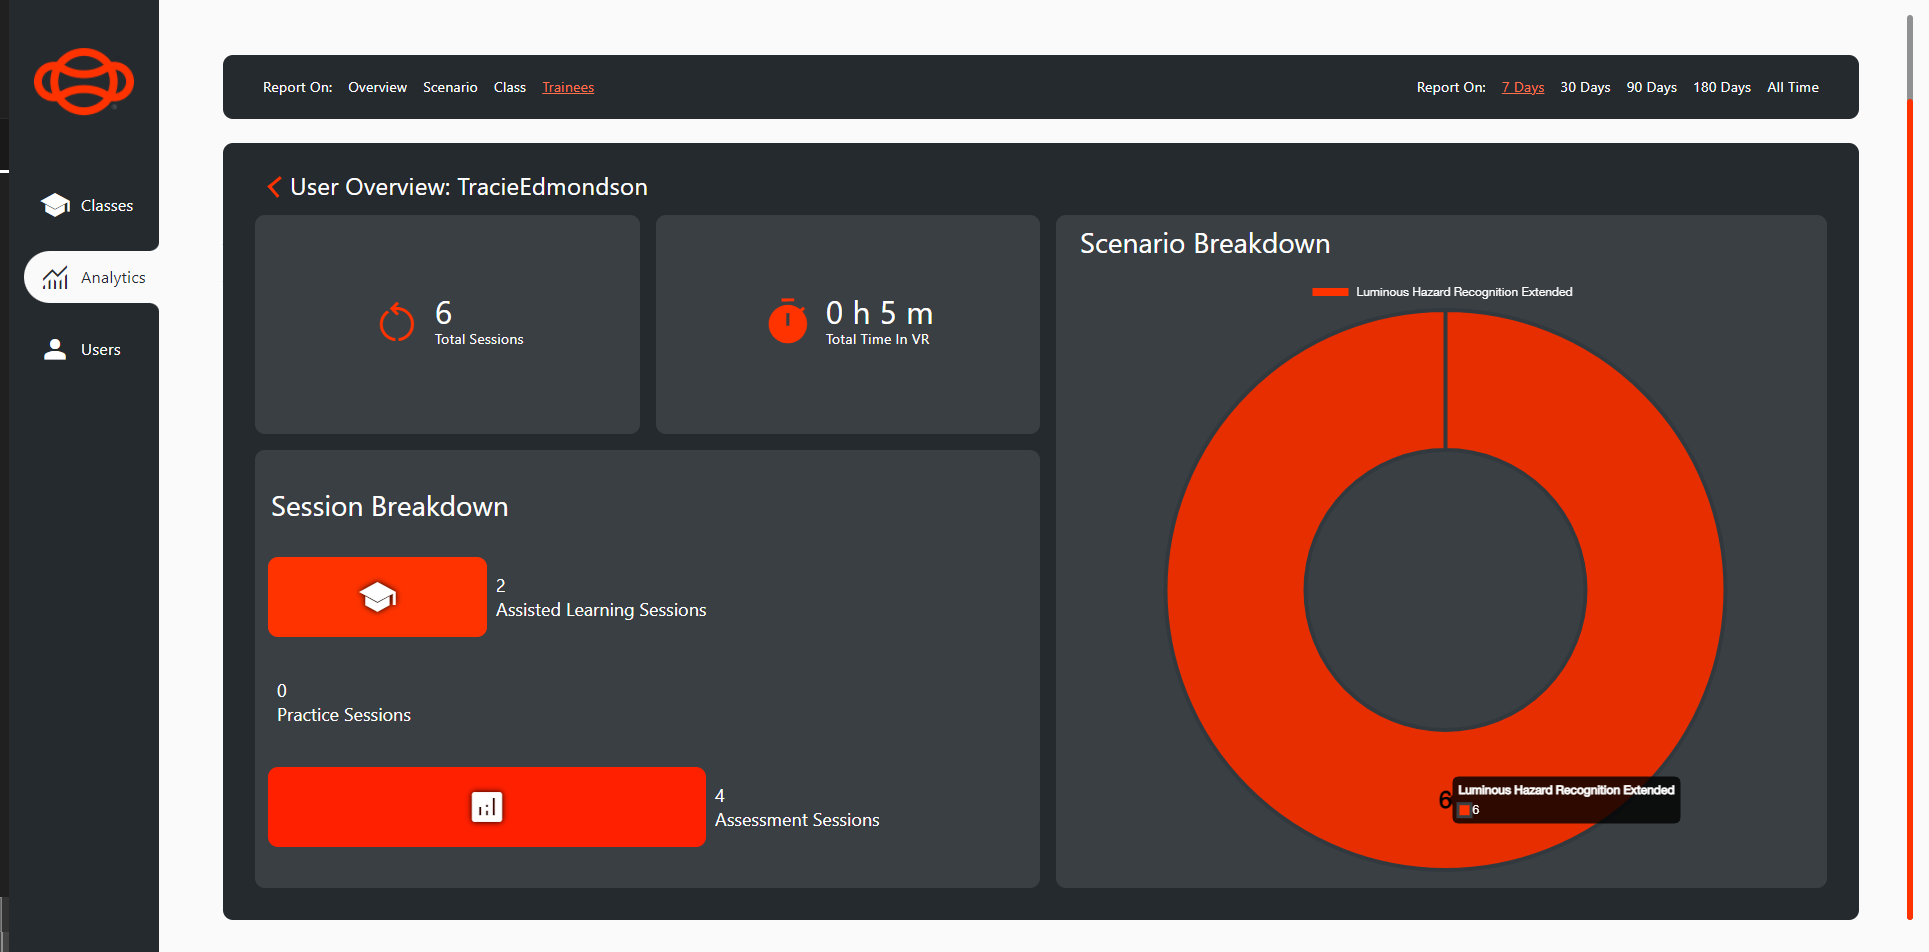
Want to see how individual Trainees are doing? Select the “Trainee” section on the top bar, and select a Trainee from the list that appears. With a user selected, you can, at a glance, see how many sessions they have taken part in with “Total Sessions”, how long they’ve spent in VR with “Total Time in VR”, a breakdown of all the content they have taken part in with the “Scenario Breakdown” section, and which modes the user is using the most with “Session Breakdown”.

Analytics - Trainee Selected
Roles and Functionality within this page
Functionality | Administrator | Trainer | Trainee |
|---|---|---|---|
View Page | Yes | Yes | No |
